7,000Lifetime licenses · then never again

Advanced Technical Charting & Analytics Software for Financial Market

Skychart is a desktop lab for rule-based traders — fast charts and fifty indicators for reading the market, two-line strategies for testing what you believe, and a walk-forward grade that tells you what survives. Because you picked the rule after seeing the data, and it knew.

One-time payment. 14-day refund, no questions. Runs entirely on your machine.

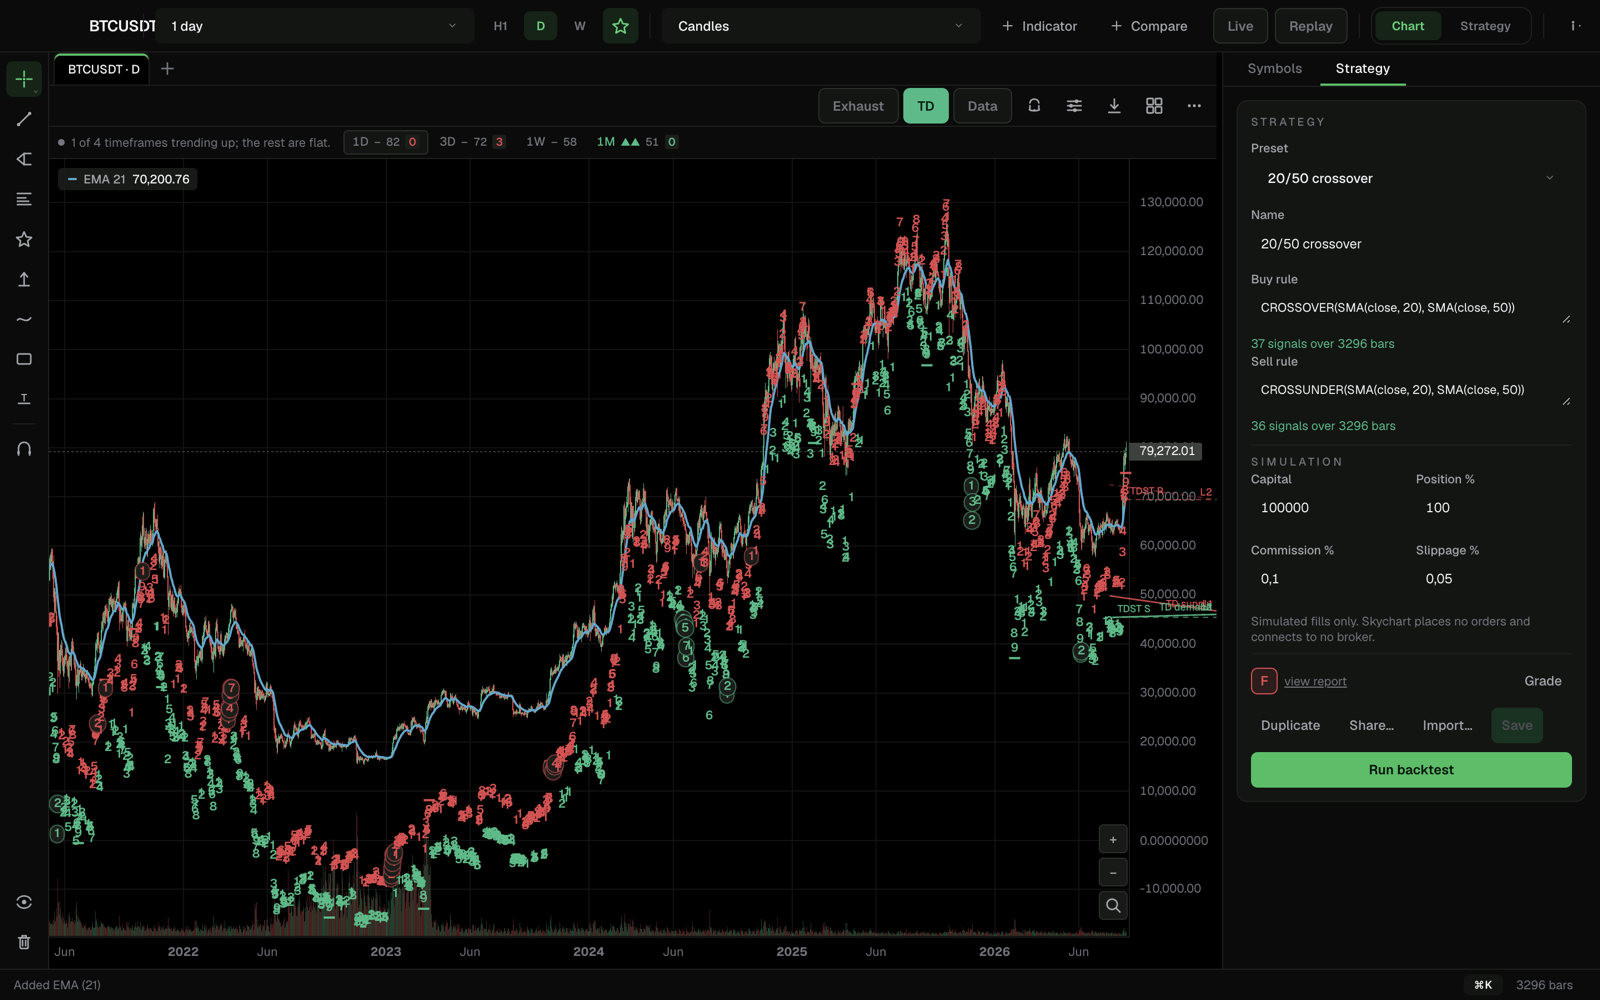
The Skychart workspace: BTCUSDT daily candles with TD Sequential counts, an EMA 21 overlay and an RSI pane
The actual workspace — BTCUSDT daily, TD Sequential counts, EMA 21, an RSI pane. 1,000 bars came bundled; no account, no network.
What Skychart is

A trading lab on your own machine.

Skychart is a desktop app for people who trade on rules, not tips. Charts and fifty indicators for reading the market. A plain-algebra language for writing what you believe. An honest backtest — and a letter grade — for finding out whether you're right. Alerts that keep watch after you close the window. Your data never leaves your disk, it places no orders, and it connects to no broker.

Here's how an afternoon goes.

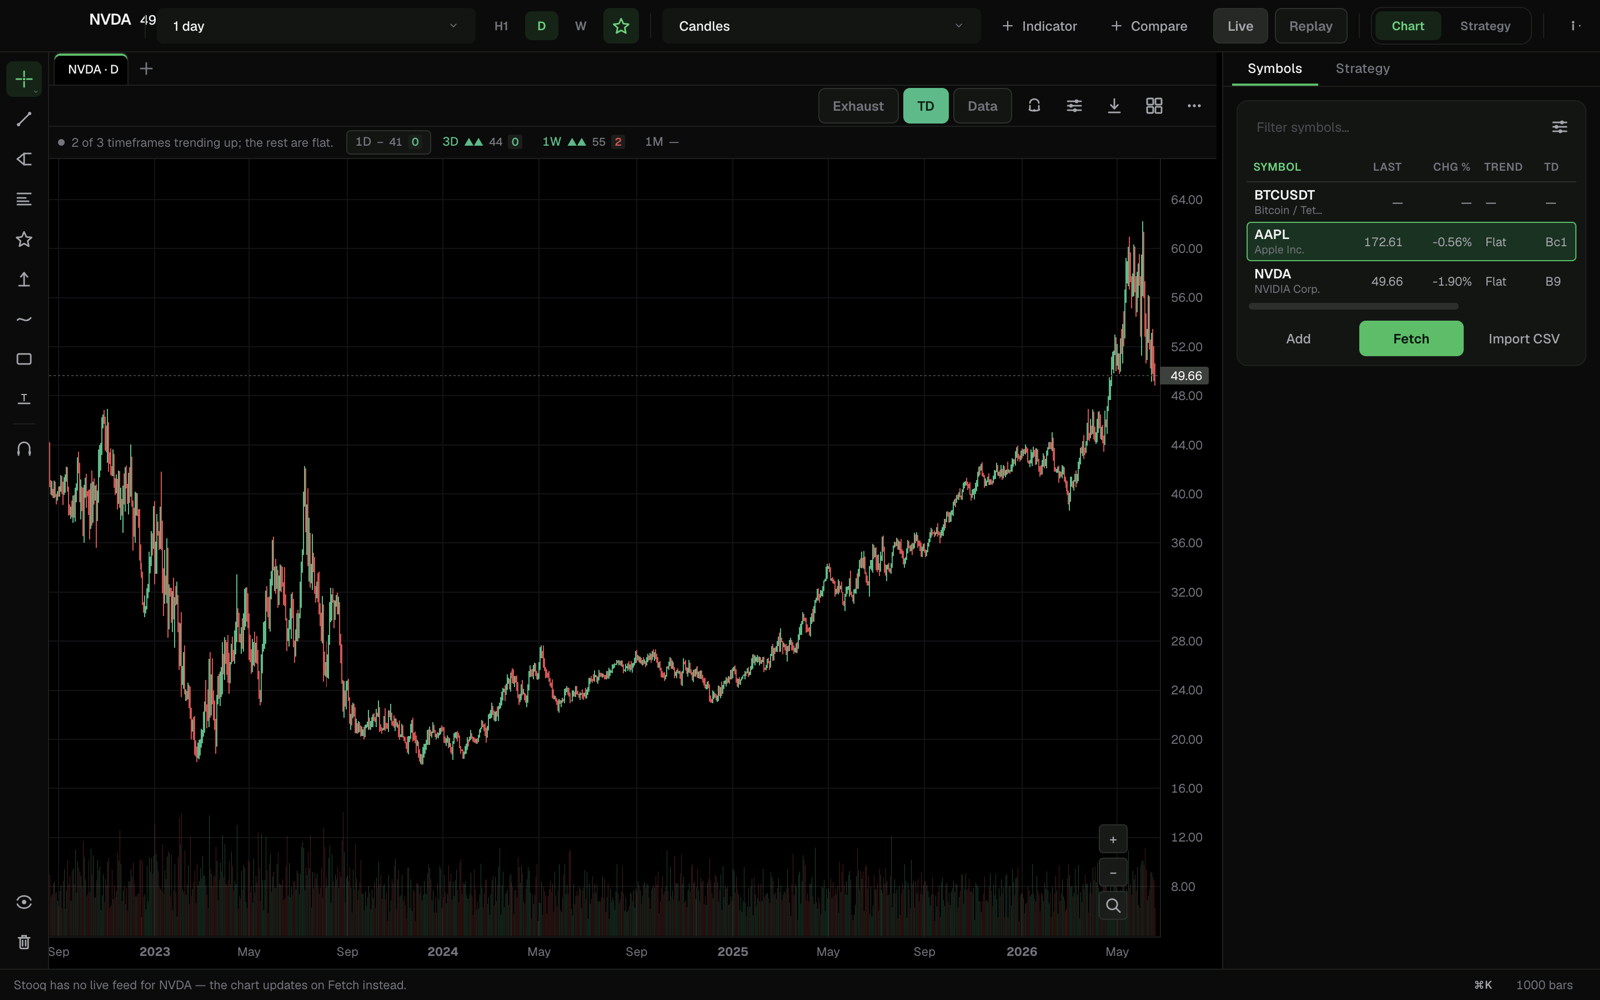
Skychart watching NVDA daily with the live watchlist alongside
Step 1 — Watch

Read the market

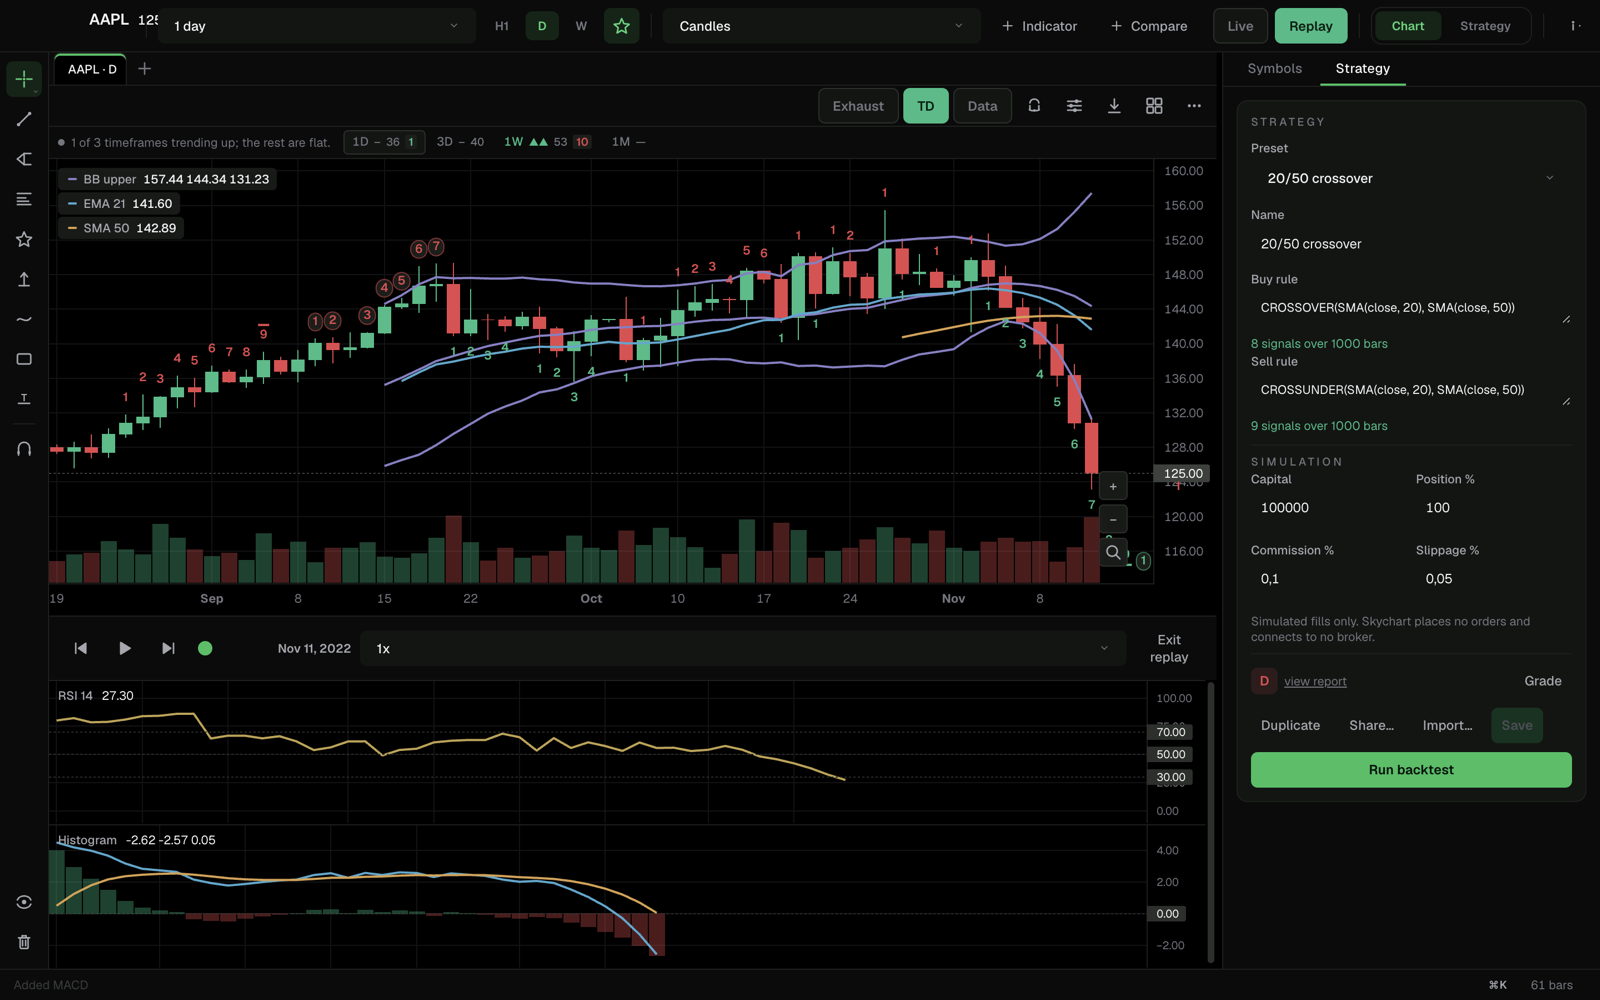
Open any chart — crypto, equities, forex, futures. Fifty indicators, drawing tools, exhaustion counts, four timeframes at once. A hundred thousand bars render without a stutter, and the watchlist tracks prices while you read.
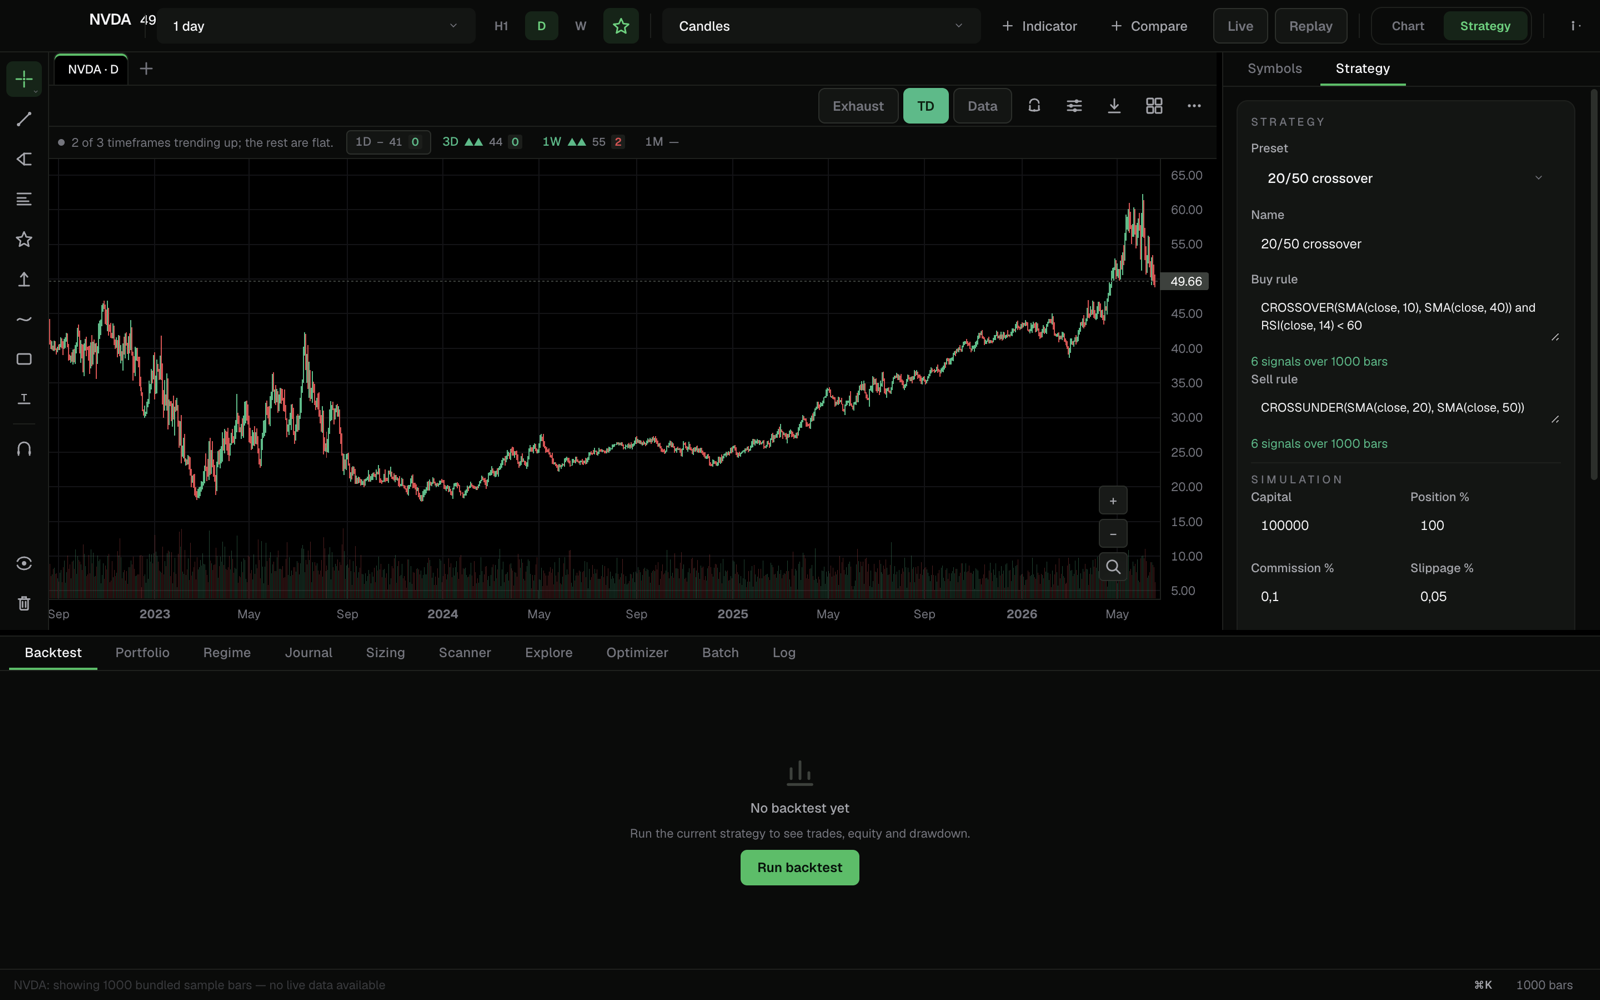
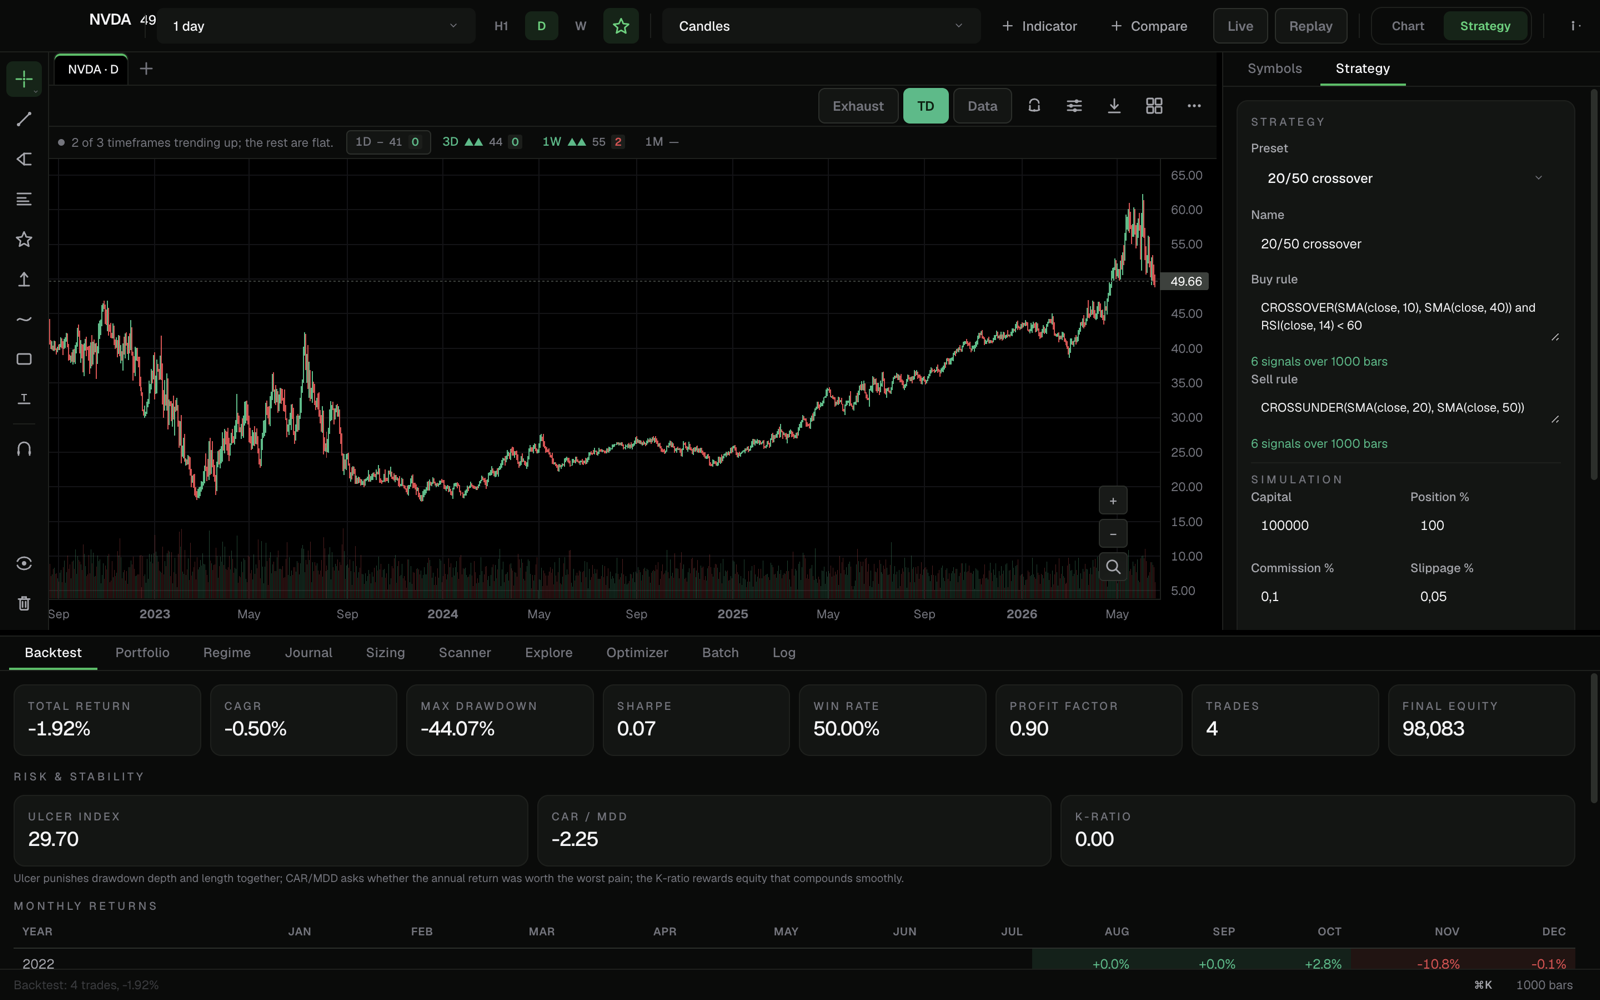
Writing a strategy in Skychart's rule editor, with live signal counts updating as you type
Step 2 — Write

Say what you believe

Your strategy is two lines of plain algebra — buy when this, sell when that. If you can write a spreadsheet condition, you can write one. The editor counts your signals over history while you type, so you know immediately if your rule ever fires.

A Skychart backtest returning an honest losing result: four trades, minus 1.92%, 44 percent drawdown
Step 3 — Test

Find out the truth

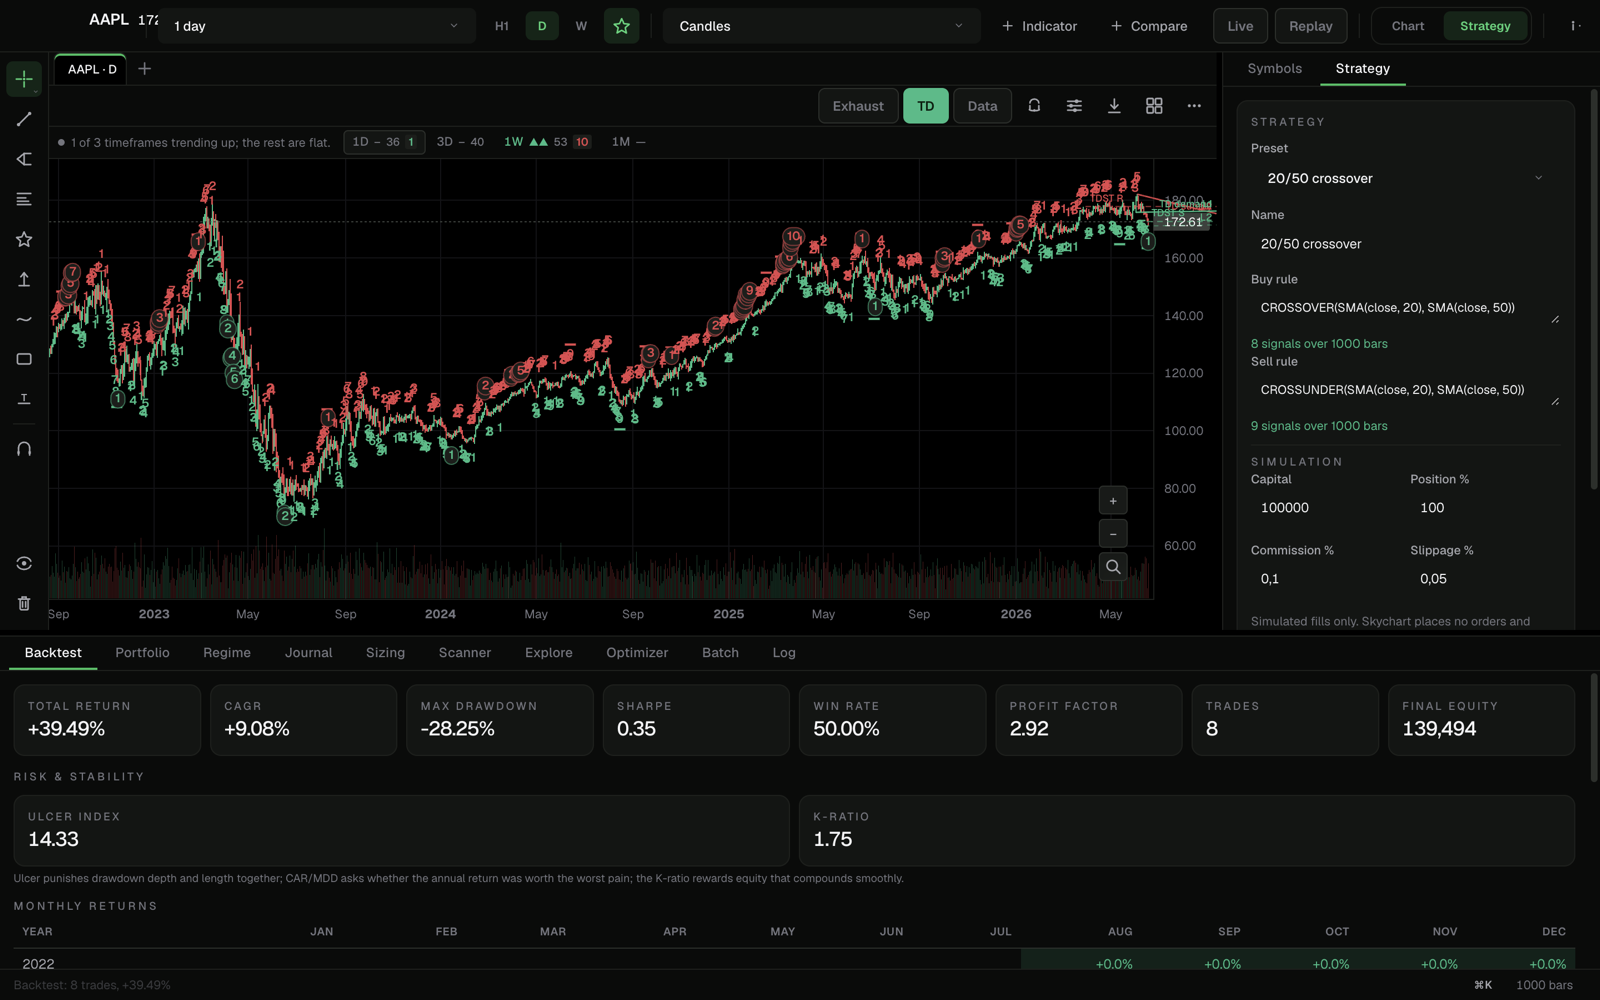
One click: fills at the next bar's open, your commission and slippage included. This rule lost 1.92% and drew down 44% — and Skychart says so, because the point isn't flattery, it's the truth before real money is involved. The walk-forward grade then tells you whether it survives data it never saw.

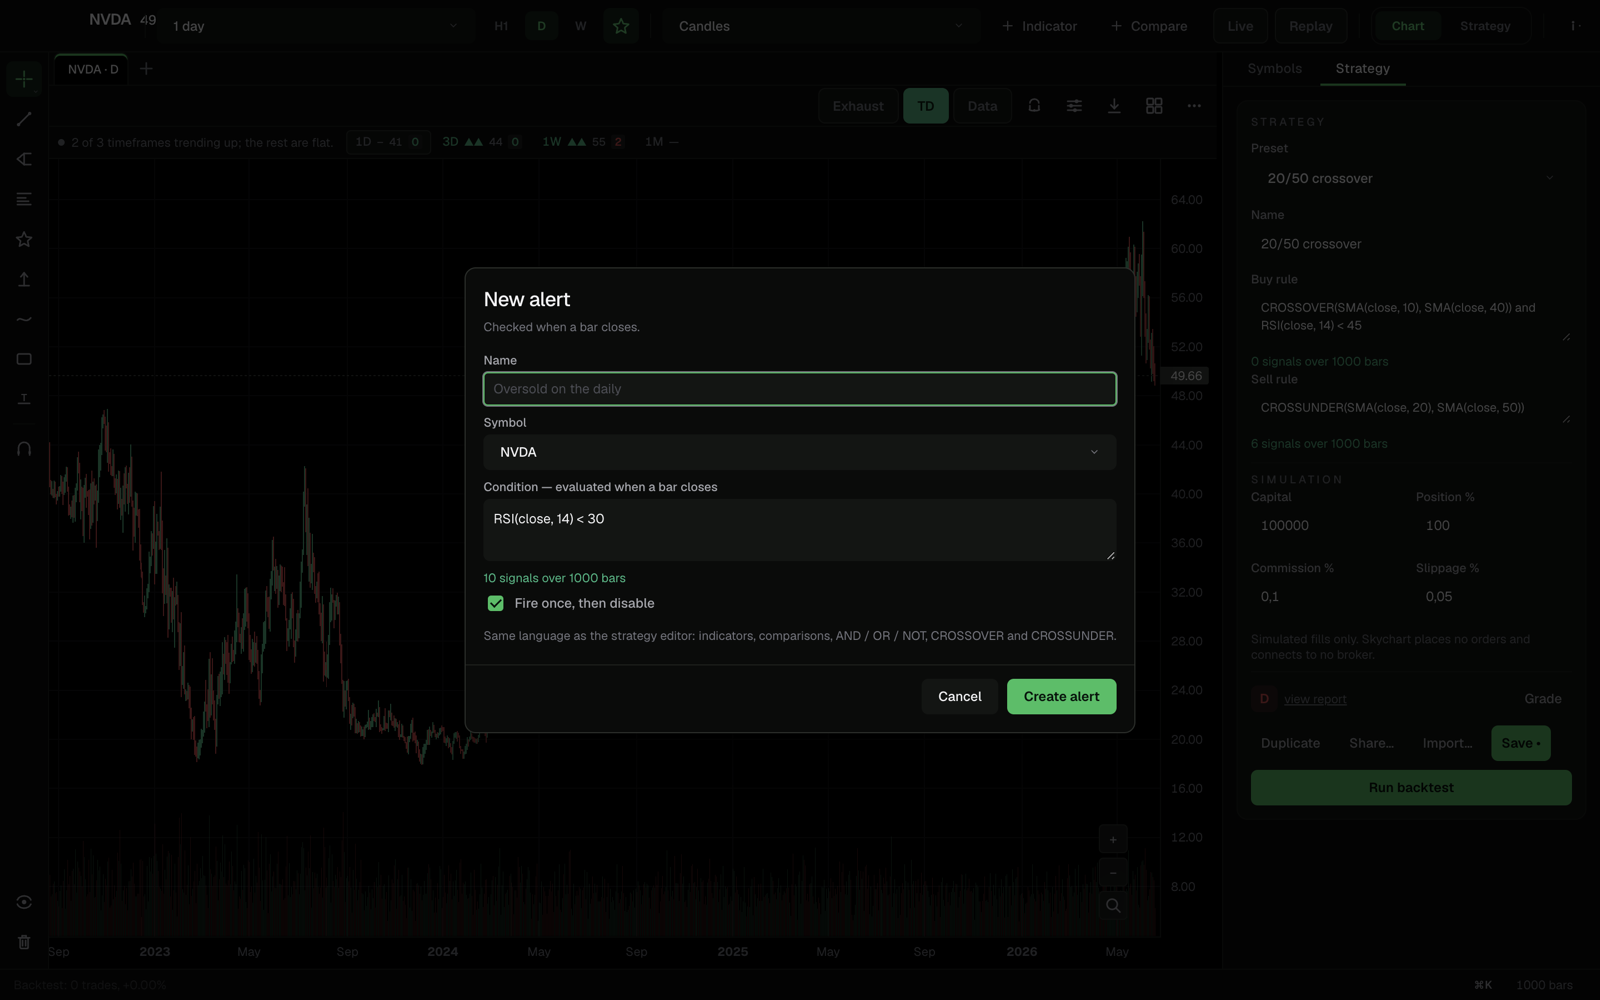
Creating an alert in Skychart: RSI below 30 on NVDA, checked when a bar closes
Step 4 — Keep watch

Let it take the night shift

Alerts use the same rule language and keep checking bars after you close the window. The scanner runs your screens across the whole watchlist on a schedule. You live your life; Skychart watches the market and speaks up when your rule fires.

01The problem

Four ways a backtest lies. One instrument for each.

Every one of these has cost someone real money. Skychart was built so each lie has a specific tool standing in its way.

01 Lookahead

It traded on tomorrow's open

Most backtests fill at the close of the bar that generated the signal — a price you could never actually get.

Skychart executes every fill at the next bar's open. Structurally. You can't turn it off — you'd only want to when fooling yourself.

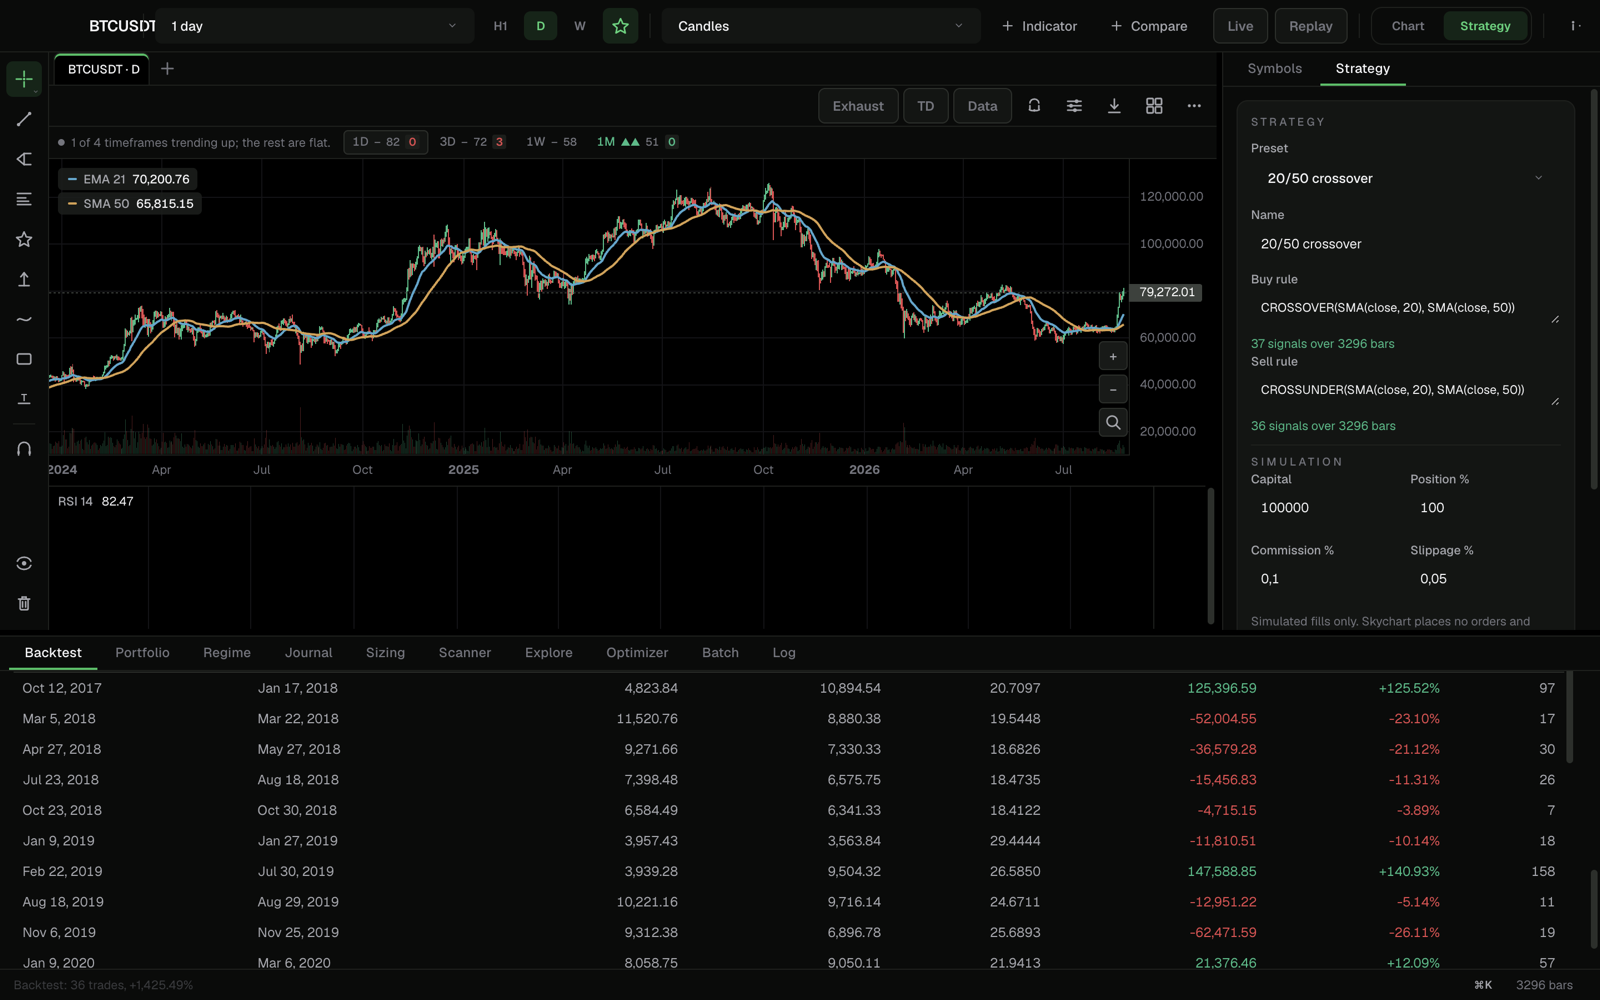
Skychart's backtest trade ledger: entries and exits dated and priced, filled at each next bar's open
The instrument — the trade ledger. Every entry and exit dated, priced and filled at the next bar's open.
02 Curve-fitting

It memorized the past

A rule tuned until the equity curve points up has learned the data, not the market. Change the year and it falls apart.

Skychart picks parameters in-sample, then demands proof on out-of-sample bars the choice never touched. Only that half counts.

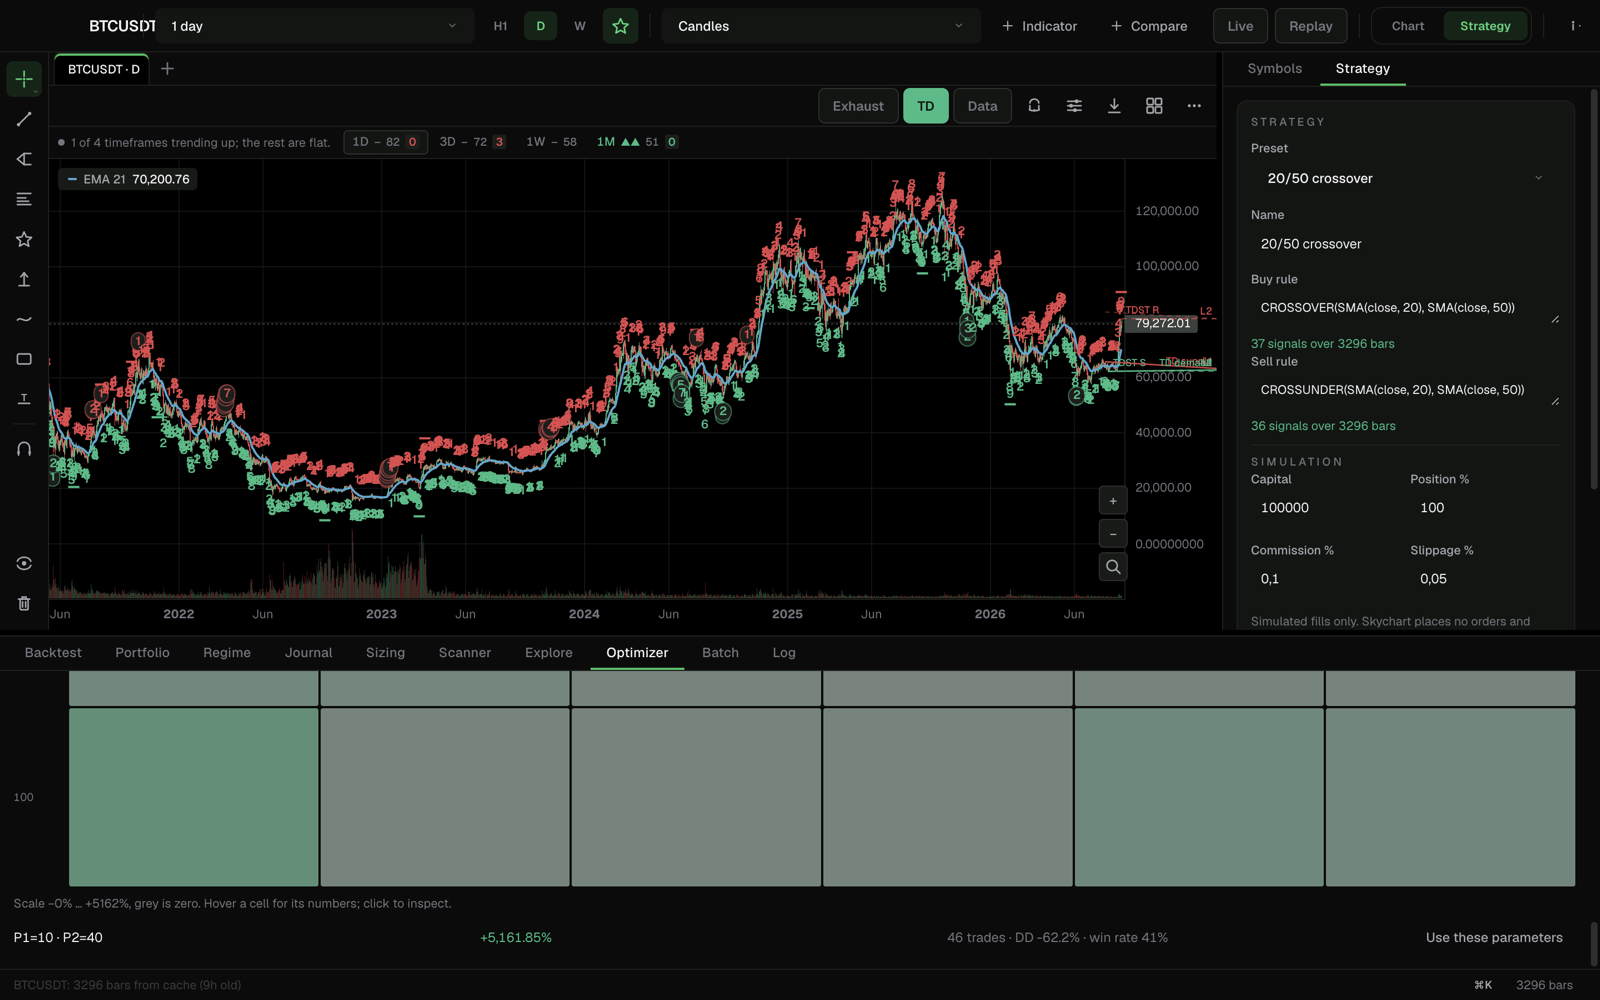
Skychart's full-history sweep: a heatmap of every SMA parameter combination, with the best cell's plateau ratio
The instrument — the full-history sweep. The whole parameter landscape at once: a lone spike can't hide, and this one didn't — plateau ratio 0.37.
03 One lucky window

Its average hid a single miracle

A great average return can be one bull stretch carrying a decade of nothing.

The grade scores consistency across every window — 20% of the letter — so one lucky period can't carry an average.

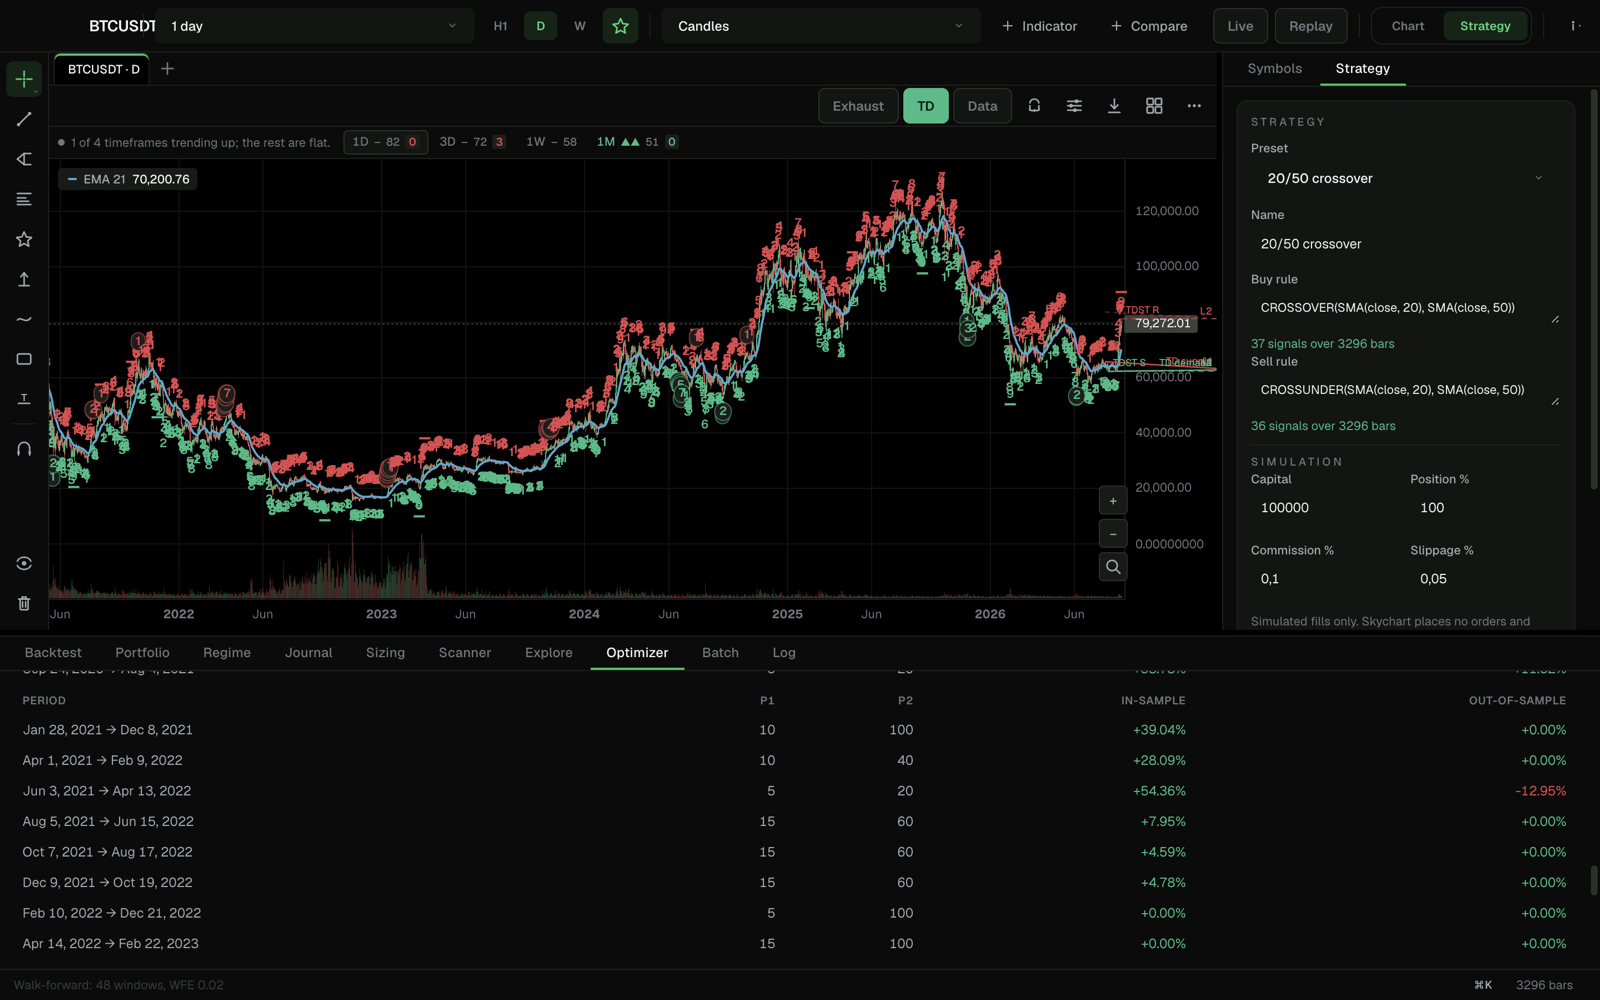
Skychart's walk-forward ledger: each window's in-sample return beside its out-of-sample result
The instrument — the walk-forward ledger. Each window's in-sample promise beside its out-of-sample reality, all 48 of them.
04 Survivorship of ideas

You only tested the winner

If you tried forty rules and kept the best, the winner's backtest is a mirror — it reflects your selection, not an edge.

A Monte Carlo over trade orderings shows how often the account survives pure chance — and the report names the weakness in plain sentences.

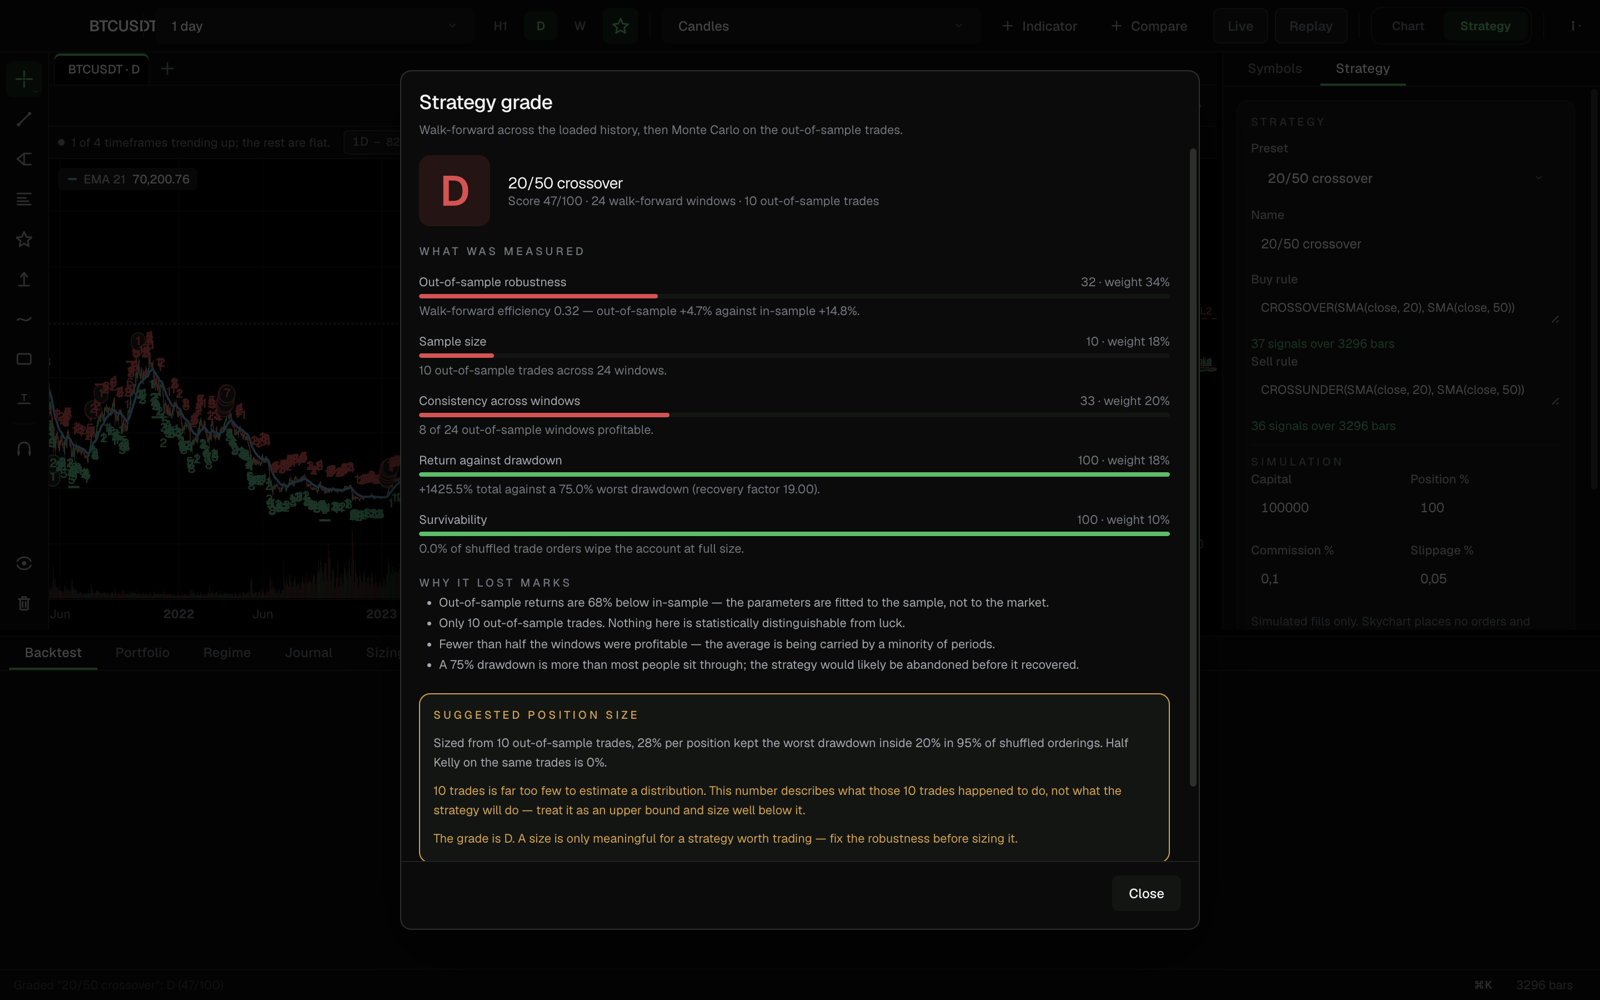
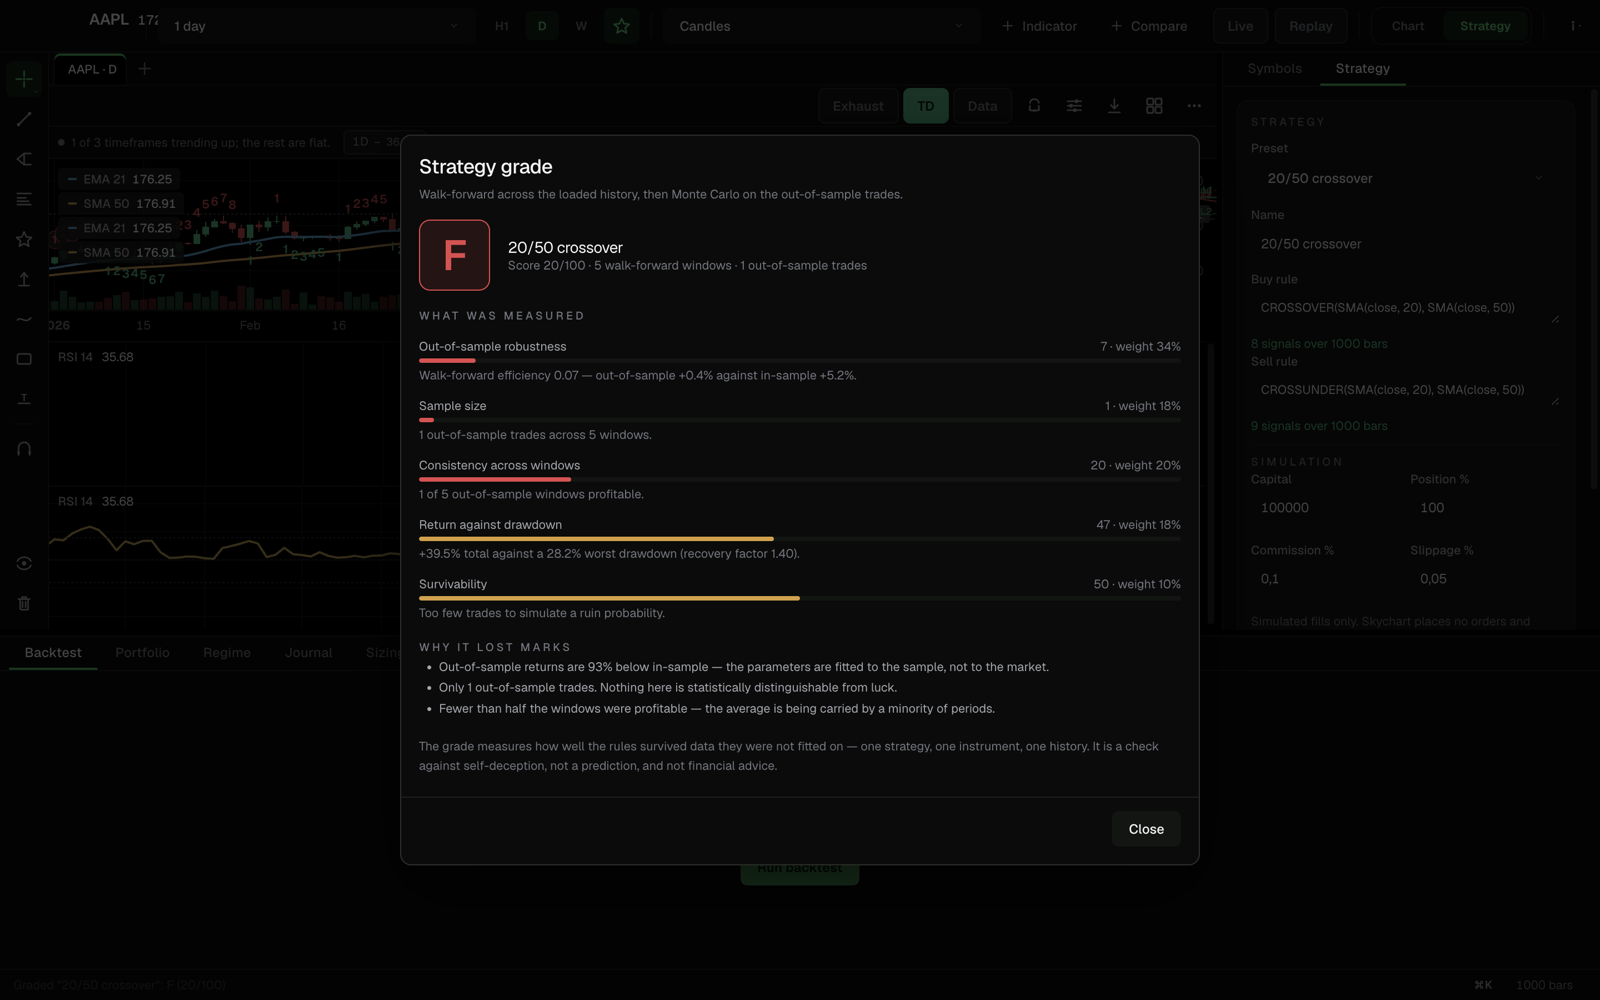
Skychart's grade report on a 20/50 crossover: an honest F with the structural weaknesses named
The instrument — the grade. Out-of-sample proof with a Monte Carlo over trade orderings, so the winner of forty tries still has to survive data it never saw.
The same strategy, both stories. The backtest's word is one smooth line. The walk-forward is what grading actually measures — toggle between them.
02The grade

One letter, earned on data your rules never saw.

252 bars in-sample, 126 out-of-sample, walking forward through your entire history. Everything reported comes from the out-of-sample halves.

Fig. 02 — The walk-forward. In-sample 252, out-of-sample 126, stepping 126 at a time. Scroll — the window walks the history as you do. The letter is earned only on the bright stretch.
A85–100

Held up out-of-sample. Rare enough to trust carefully.

B70–84

Mostly survived. Paper-trade before sizing up.

C55–69

Partly curve-fit. The report says where.

D40–54

Mostly fitting. Do not trade this.

FBelow 40

The backtest was a mirror. Skychart just told you.

C Score 62 / 100

Partly curve-fit. The report says where.

Out-of-sample robustness34%
Consistency across windows20%
Sample size18%
Return against drawdown18%
Survivability10%

Illustrative decomposition. The real report lists the specific structural weaknesses it found, in plain sentences.

What the grade cannot tell you.

  • It is one strategy on one instrument. A B on BTCUSDT says nothing about AAPL.
  • It cannot see your earlier attempts. Grading the best of forty tries doesn't undo the forty.
  • It assumes your fills are achievable. Optimistic slippage in, optimistic grade out.
  • It assumes the data is right. One unadjusted split and it graded something that never happened.

Most tools hide their limits. We document them in the manual. A grade you can argue with is worth more than a green equity curve you can't.

03Charting & analysis

Read the market first. Then test what you believe.

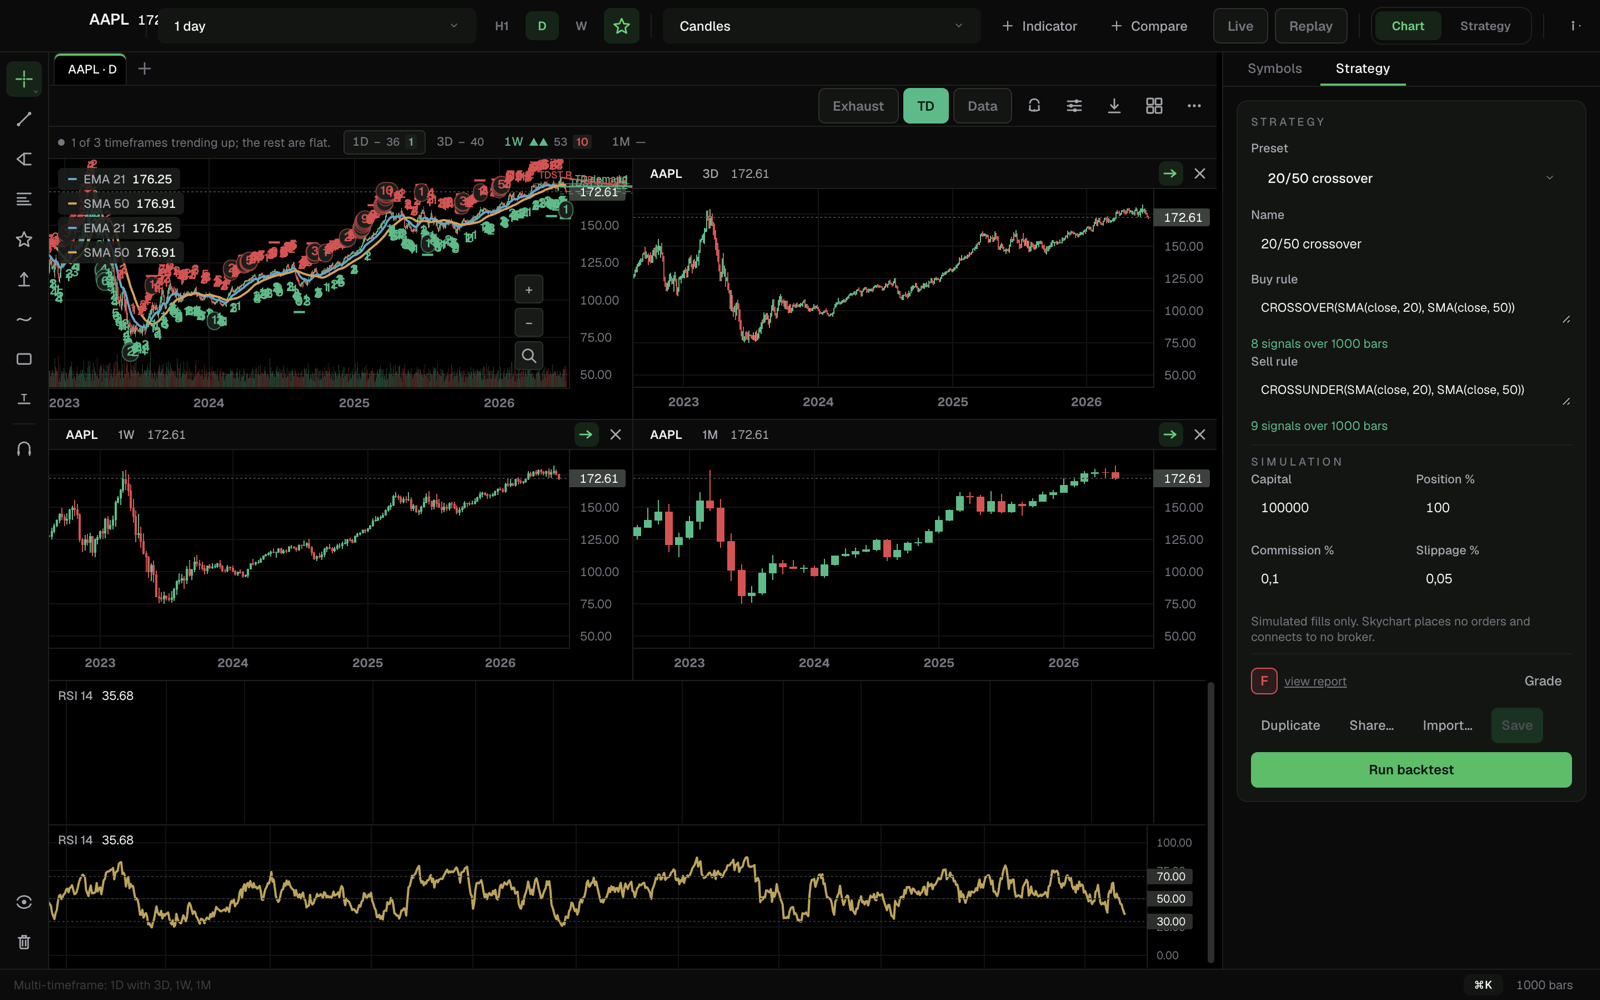
Fifty indicators, Bollinger to Ichimoku. Fibonacci and Gann tools, TD exhaustion counts, bar replay, multi-timeframe layouts — all computed locally, all keyboard-fast.

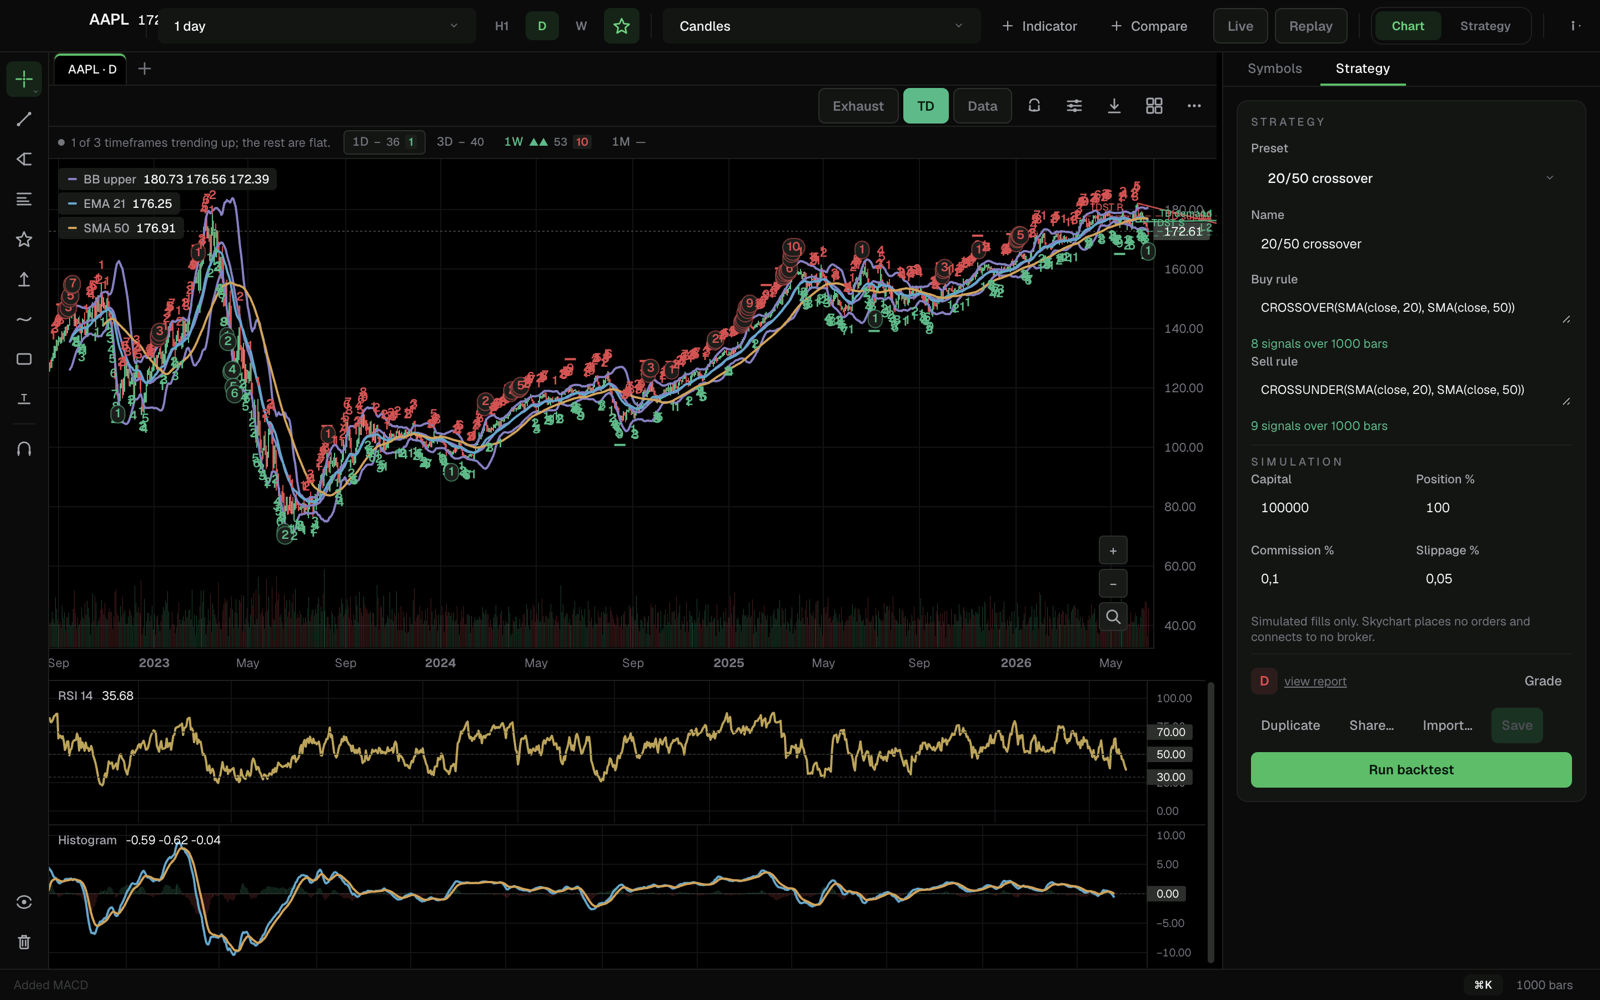
Skychart with Bollinger bands, EMA 21 and SMA 50 overlaid, RSI and MACD panes beneath, over 1,000 bars
Fig. 03 — Bollinger bands, EMA 21 and SMA 50 overlaid, with RSI and MACD panes beneath — 1,000 bars of bundled history, panned without a stutter.
04The desk

Two lines of algebra is a complete strategy.

Write it, backtest it, grade it, scan the whole market with it, share it. No scripts, no build step — the compiler evaluates your rule bar by bar.

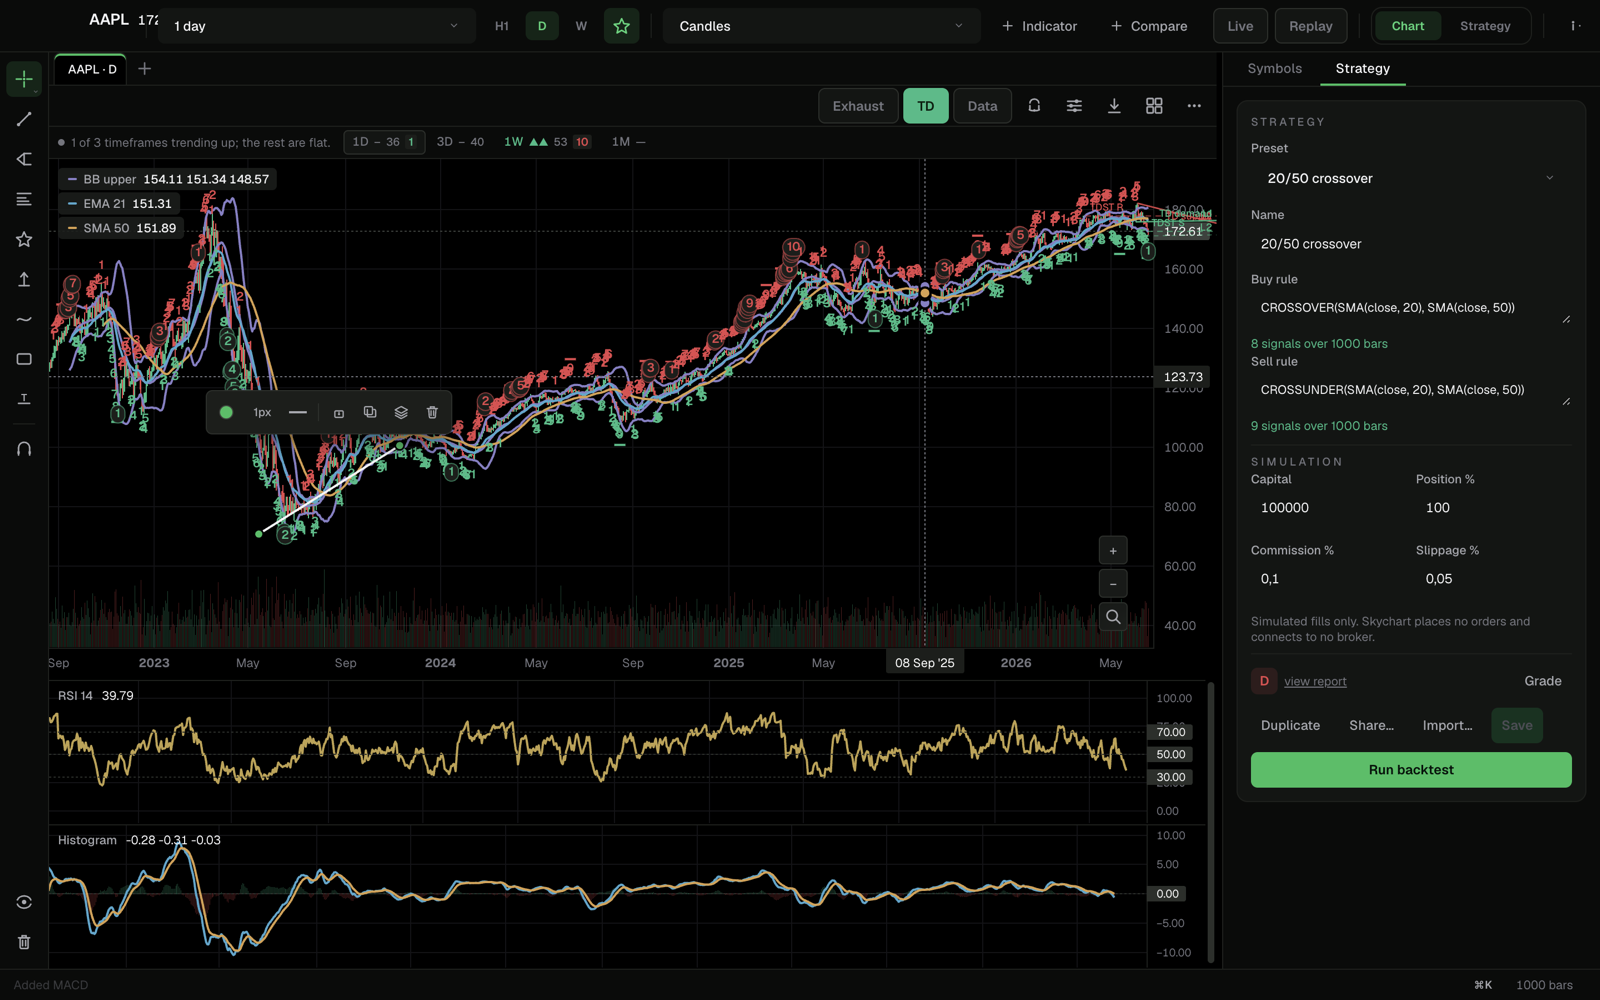
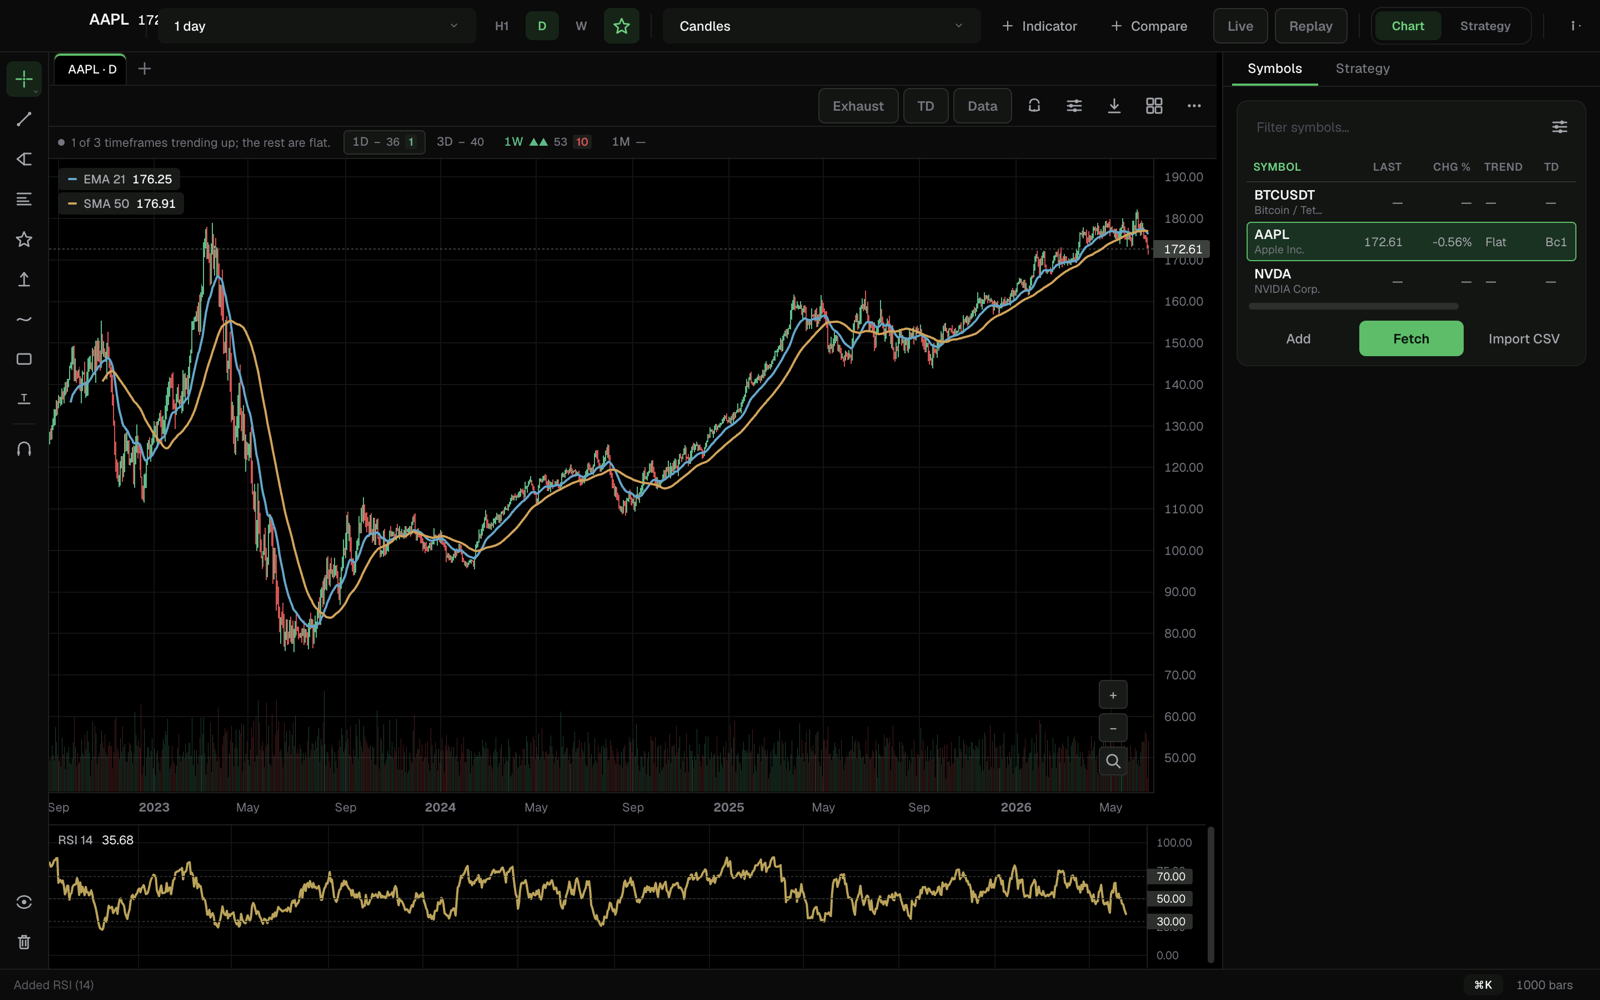
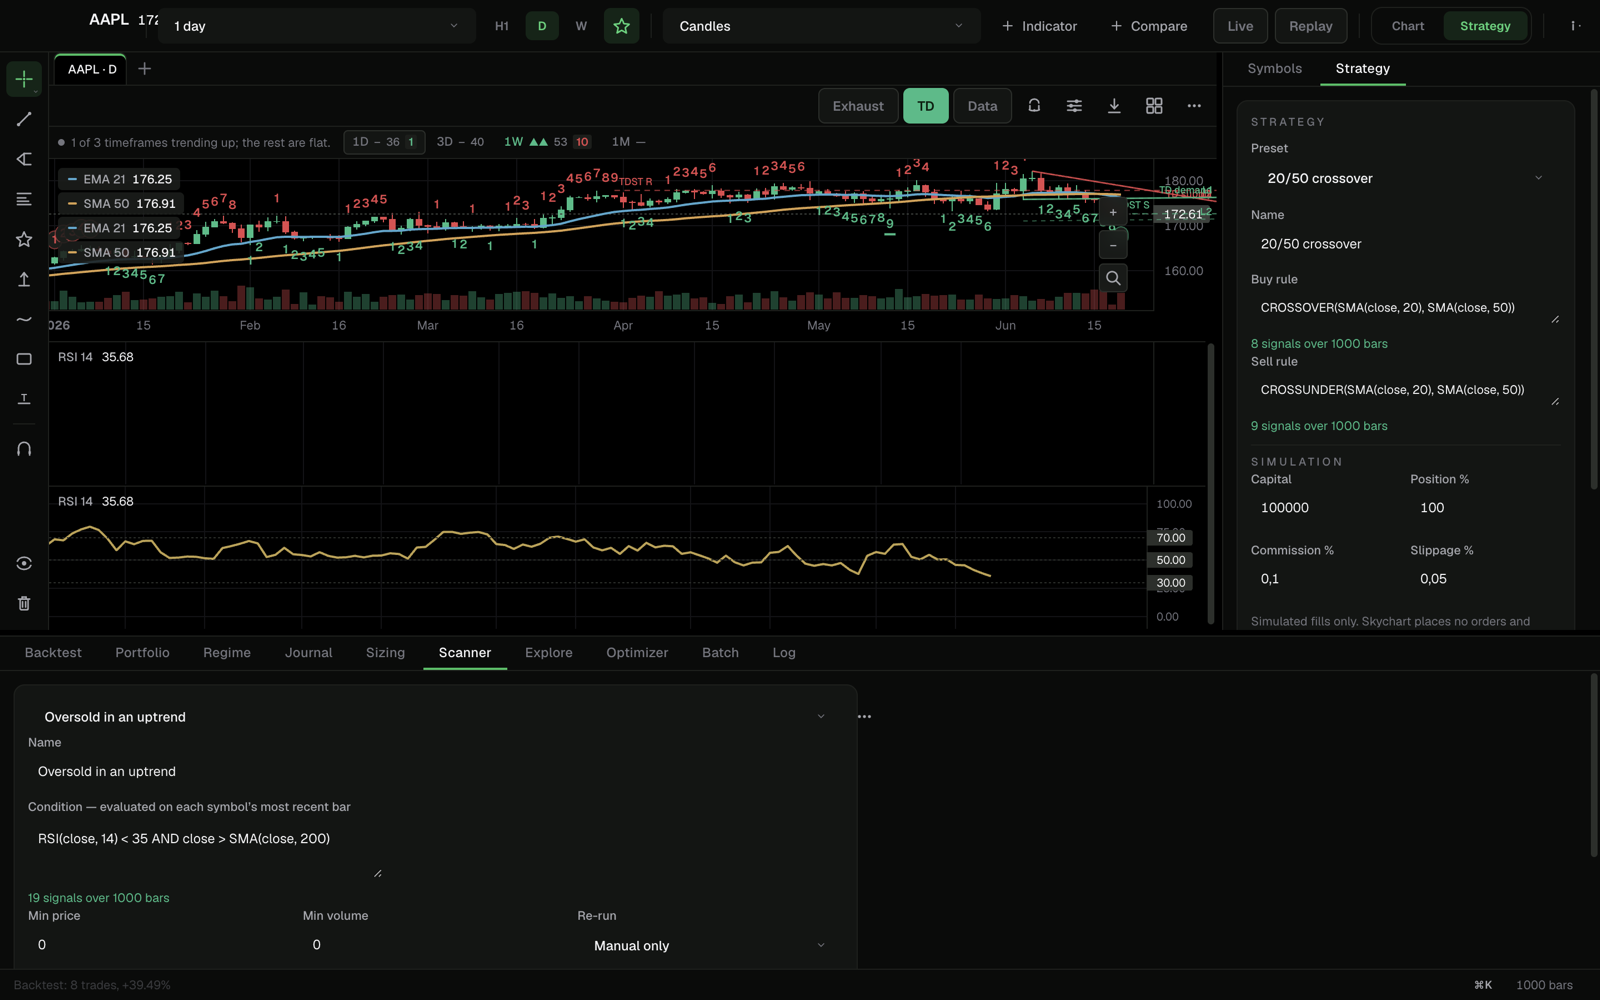
Skychart chart workspace: AAPL daily candles with EMA 21 and SMA 50 overlays, an RSI pane, volume and the watchlist
Fig. 06 — The chart workspace. Candles and volume, EMA 21 / SMA 50, an RSI pane — panned through 1,000 bars on a laptop, offline.

The rule language

Plain algebra over price, volume and fifty indicators. If you can write a spreadsheet condition, you can write a Skychart strategy — and the grade will tell you what it's really worth.

See what it grades
buy:  SMA(close, 20) > SMA(close, 50) and RSI(close, 14) < 30
sell: SMA(close, 20) < SMA(close, 50)

Try the rule language right here

Drag the two moving averages. Every crossover below is a trade — computed in your browser, on 180 bars of sample data, as fast as you can drag.

Trades0 Return+0.0% Win rate0%
buy:  CROSSOVER(SMA(close, 10), SMA(close, 40))  ·  sell: the cross back
4.1

Charts that keep up

Candlesticks with volume, Bollinger channels, crosshair badges and HUD metrics — panning and zooming at 100,000 bars without a stutter.

100k bars · 60fps
4.2

Alerts that outlive the window

Rule and price alerts keep watching after you close Skychart. Bar-close semantics, not tick noise — signals, not static.

Background · Local
4.3

Scan the whole market

Run your rules across entire universes on a schedule. Expression columns let the scanner report whatever you ask it to.

Screens · Schedules · Universes
4.4

Your own indicators, sandboxed

Custom indicators run in a sandbox that can read price data and nothing else. Import a friend's strategy via share codes — and see what it does before it runs.

Reads data · Touches nothing else
4.5

Keyboard-first, local-first

Cmd+K opens the command line for everything. Candles, rules and results live in a local SQLite database — not in someone's cloud, not behind a login.

Offline · Exports anywhere
05Pricing

Pay once. Yours for life.

Every license is lifetime — all future updates included, no subscription, no renewals. Choose Mac or Windows at checkout: two activations on that platform, one backup included.

Pro

$199

Lifetime · one payment, every update included

  • Full charting & all 50 indicators
  • Rule language & backtesting
  • Walk-forward grading with full report
  • Background alerts & scanner
  • Local SQLite — your data, your disk
  • Portfolio-level grading
  • Parameter sweep heatmap
Choose Pro
Most complete

Max

$399

Lifetime · one payment, every update included

  • Everything in Pro
  • Portfolio grading — the whole system, one letter
  • Walk-forward optimizer & sweep heatmap
  • Monte Carlo position sizing
  • Priority support with diagnostics bundle
  • All updates, forever
Choose Max
5,000 Pro and 2,000 Max licenses exist. Ever. Serial numbers are issued once and never reused — the caps are enforced by the license verifier itself, not by this page.

14-day money-back guarantee. Grade your own rules on your own data. If Skychart doesn't earn its keep, reply to your receipt and every cent comes back.

06Checkout

One screen. Sixty seconds. Grade tonight.

No account to create, no call to book. Your license key is generated at checkout and emailed instantly.

Lifetime license · 2 activations, 1 backup included · 14-day refund · USDT (BEP20)

07Before you pay

Fair questions, answered straight.

Is this a subscription?

No. Every license is lifetime — one payment and all future updates are included, forever. There is no renewal, no tier downgrade, no expiry.

How do I pay?

With USDT on the BEP20 network (BNB Smart Chain). Fill in your email, click continue, and you'll get a QR code and the exact address to send to. After sending, message @qquantwolf on Telegram with your transaction hash and email — the bot confirms within minutes, worst case a human within 24 hours, and your key arrives by email.

Mac or Windows — and how many machines?

You pick your platform at checkout (we preselect the one you're on). Each license activates on two machines of that platform — your trading machine plus one backup. If you ever switch from Mac to Windows or back, one platform switch is free: just email support.

Does Skychart place trades or connect to my broker?

No — deliberately. Skychart places no orders and connects to no broker. Every fill it reports is simulated. It is a place to find out whether a rule deserves real money, not a place to hand it money.

Where does my data live?

On your disk, in a local SQLite database. No cloud sync, no account, no telemetry about your strategies. Alerts run locally in the background on your machine.

What if the grade says my favorite rule is a C?

Then it just paid for itself. The report lists the specific structural weaknesses in plain language — sample size, one lucky window, weak recovery — so you know what to fix instead of guessing.

How does the 14-day refund work?

Reply to your receipt within 14 days and say "refund". No form, no call, no questions. Your license is simply retired — its serial number is never reissued to anyone else.

Your rules are already written. You already suspect what they'd grade.

Find out tonight, on your own data, with a 14-day refund standing behind you.

Get Skychart — from $199
Fig. 11 — Where the grading happens

Skychart — $199 lifetime · Mac or Windows · 14-day refund

Get Skychart